Using Grafana for personal financial management
This post is intended to be a brain dump with quick highlights of some technologies. If you’re somewhat familiar with the stack I’ve used, hopefully there will be something useful for you to learn or to base on. It will be fast paced.
Objective
To develop an investment tracker with the following requirements:
- everything must be determined by a plain-text file;
- the only recurring input needed is sparse balance data;
- it must infer data as good as possible;
- it must maintain historic data;
- it must draw beautiful visualizations.
In other words, if I write down today the balance of some investments of mine, and 1 month from now I write down the balance of other investments, the system should be able to interpolate data so that it can plot smooth, realistic curves.
This is different from a ledger system, for which there are plenty of open source solutions.
It could be done with some Excel wizardry, I suppose. But I didn’t want to learn that much of Excel.
File syntax
I’ve decided to use the edn format, because I was determined to code the system in Clojure. Here is some simplified, mock data:
It has as little information as possible yet it still is human-readable. Nice!
Internalizing data
The first step was to convert the file contents to internal models with namespaced keys. In particular, I converted date strings to a numeric format so that I could apply traditional math over it. After some maps and reduces, we have a collection of elements such as:
Initially, I had written functions for integrals, derivatives, curve aggregation and so on. But I was reinventing the wheel. Now, I’m leveraging the robustness of time-series ecosystems.
The competitors were Prometheus, InfluxDB and Graphite. As of the time of writing, there’s no way to fetch past data into Prometheus. InfluxDB has too much SQL for my taste. Graphite was the chosen one, then.
With a simple pure function, we can export our internal models as Graphite-compatible data:
citigroup.rf.cdb_paribas 1554325794 1000.00
citigroup.rf.cdb_paribas 1554378794 1050.33
citigroup.rf.cdb_paribas 1564325312 1097.44
Now we can perform queries such as sumSeries(some.bucket.*), instead of hand crafting it directly in our code.
Visualizing balances
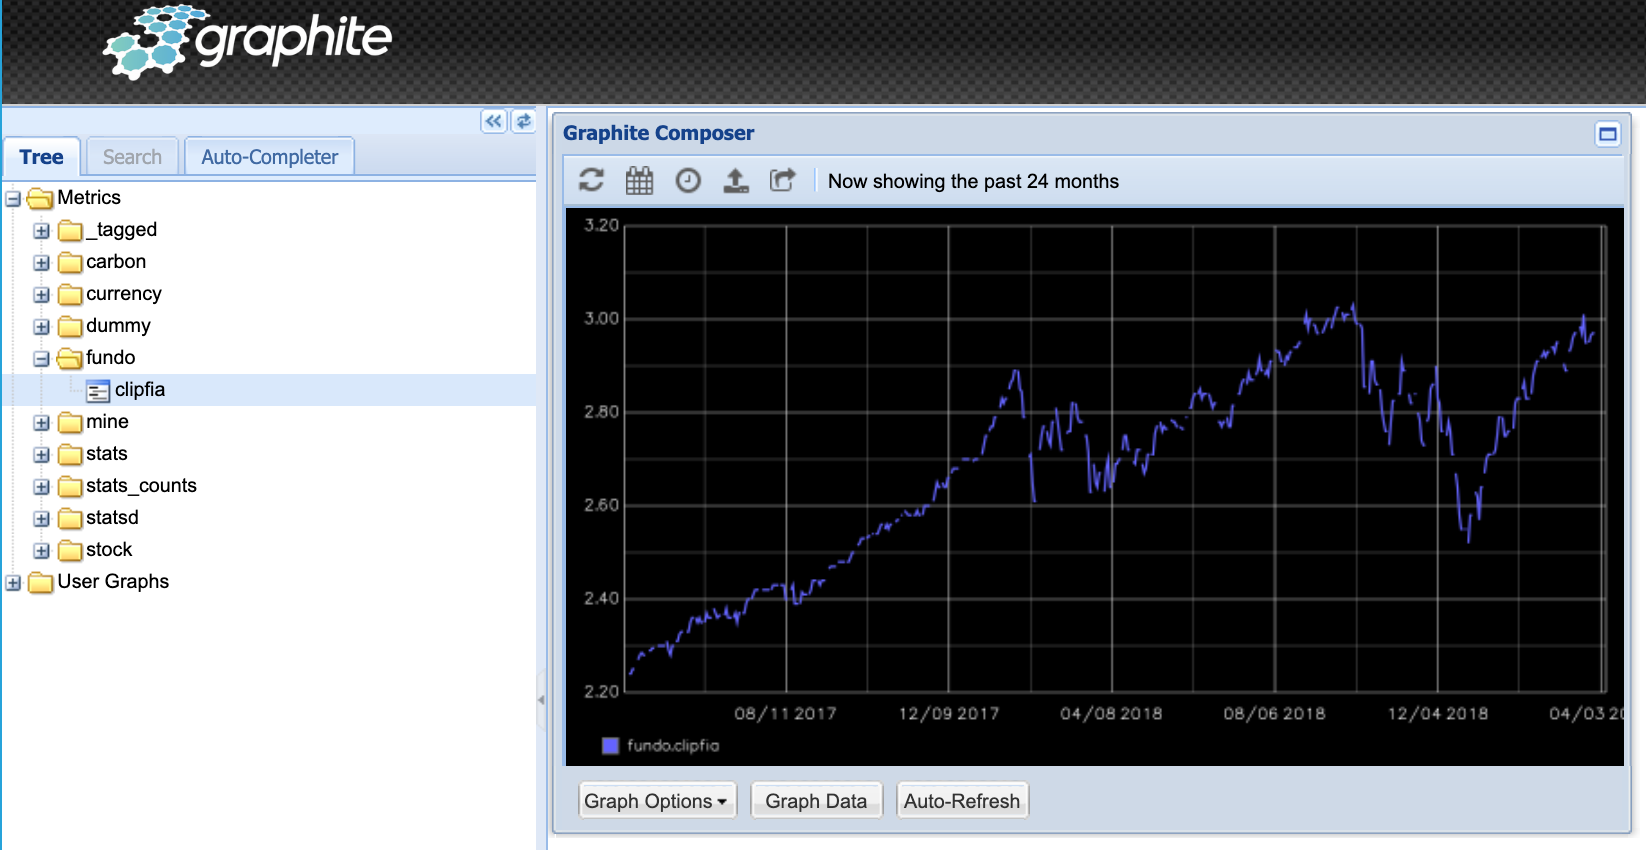
Graphite has a built-in renderer for data:
But we aren’t in the 90s anymore. I wanted to use something easier on the eyes: Grafana.
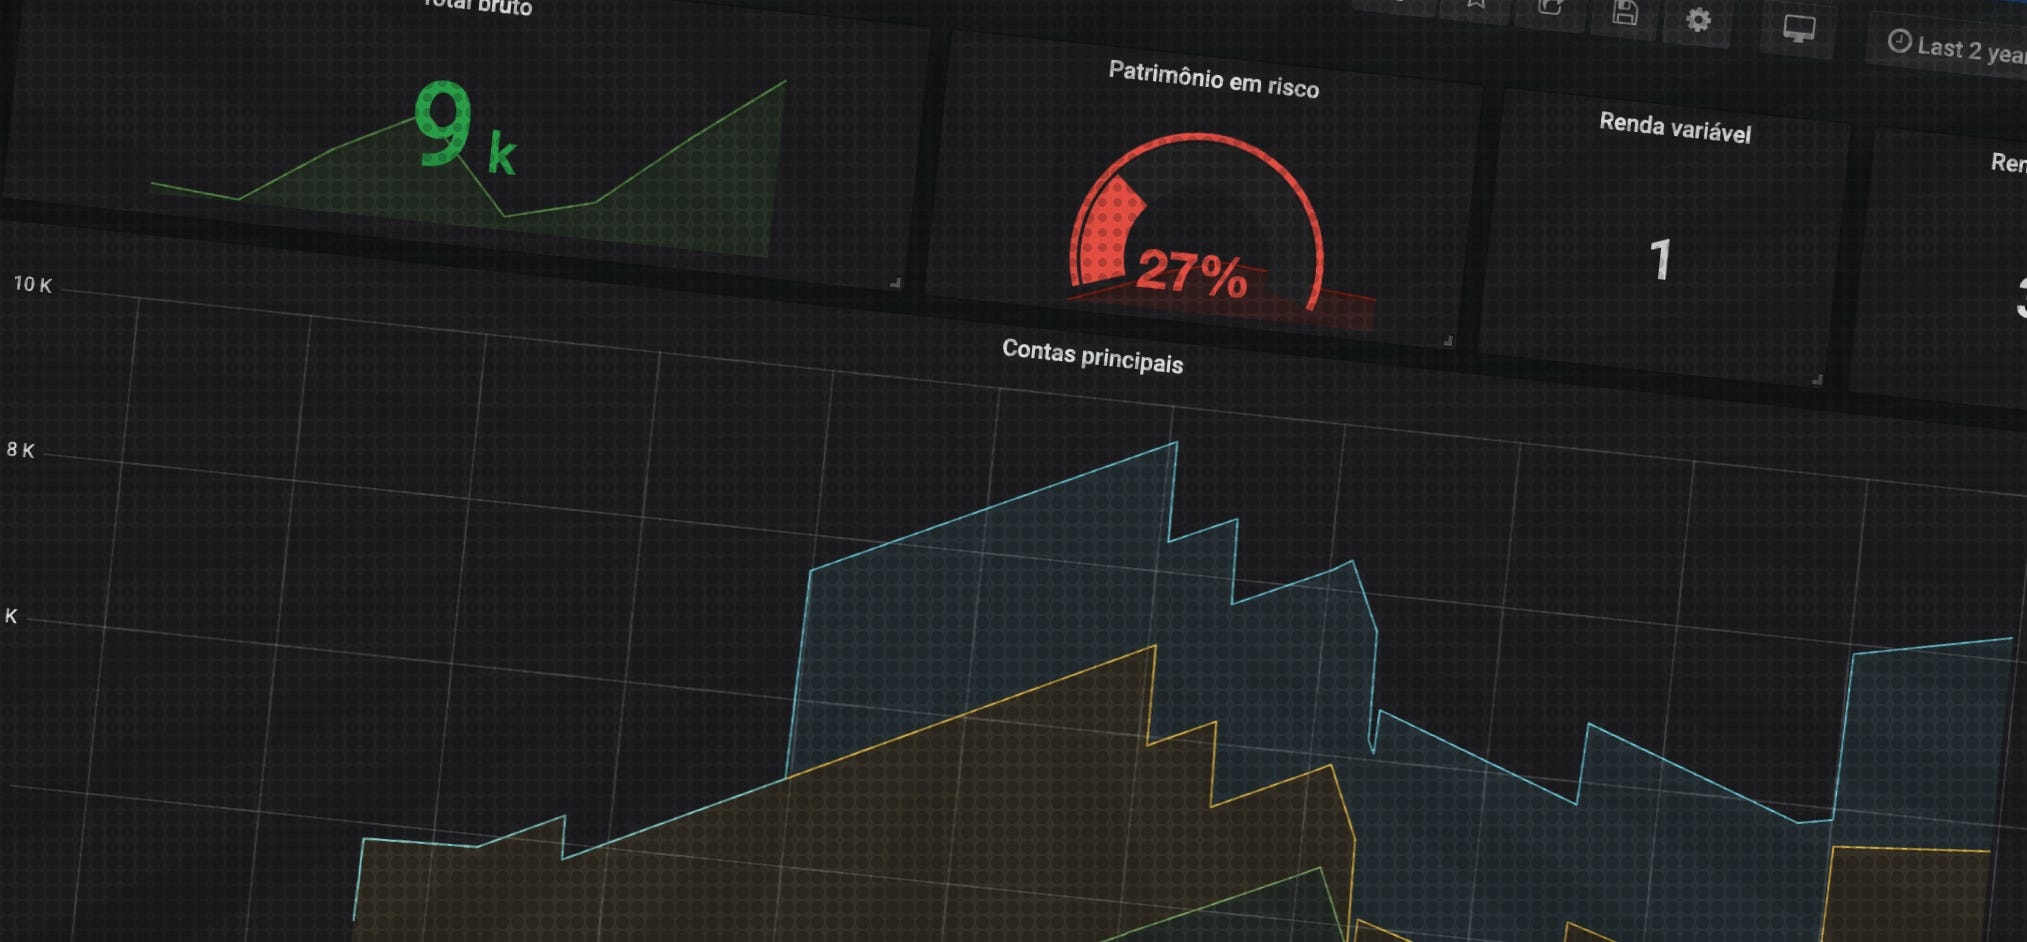
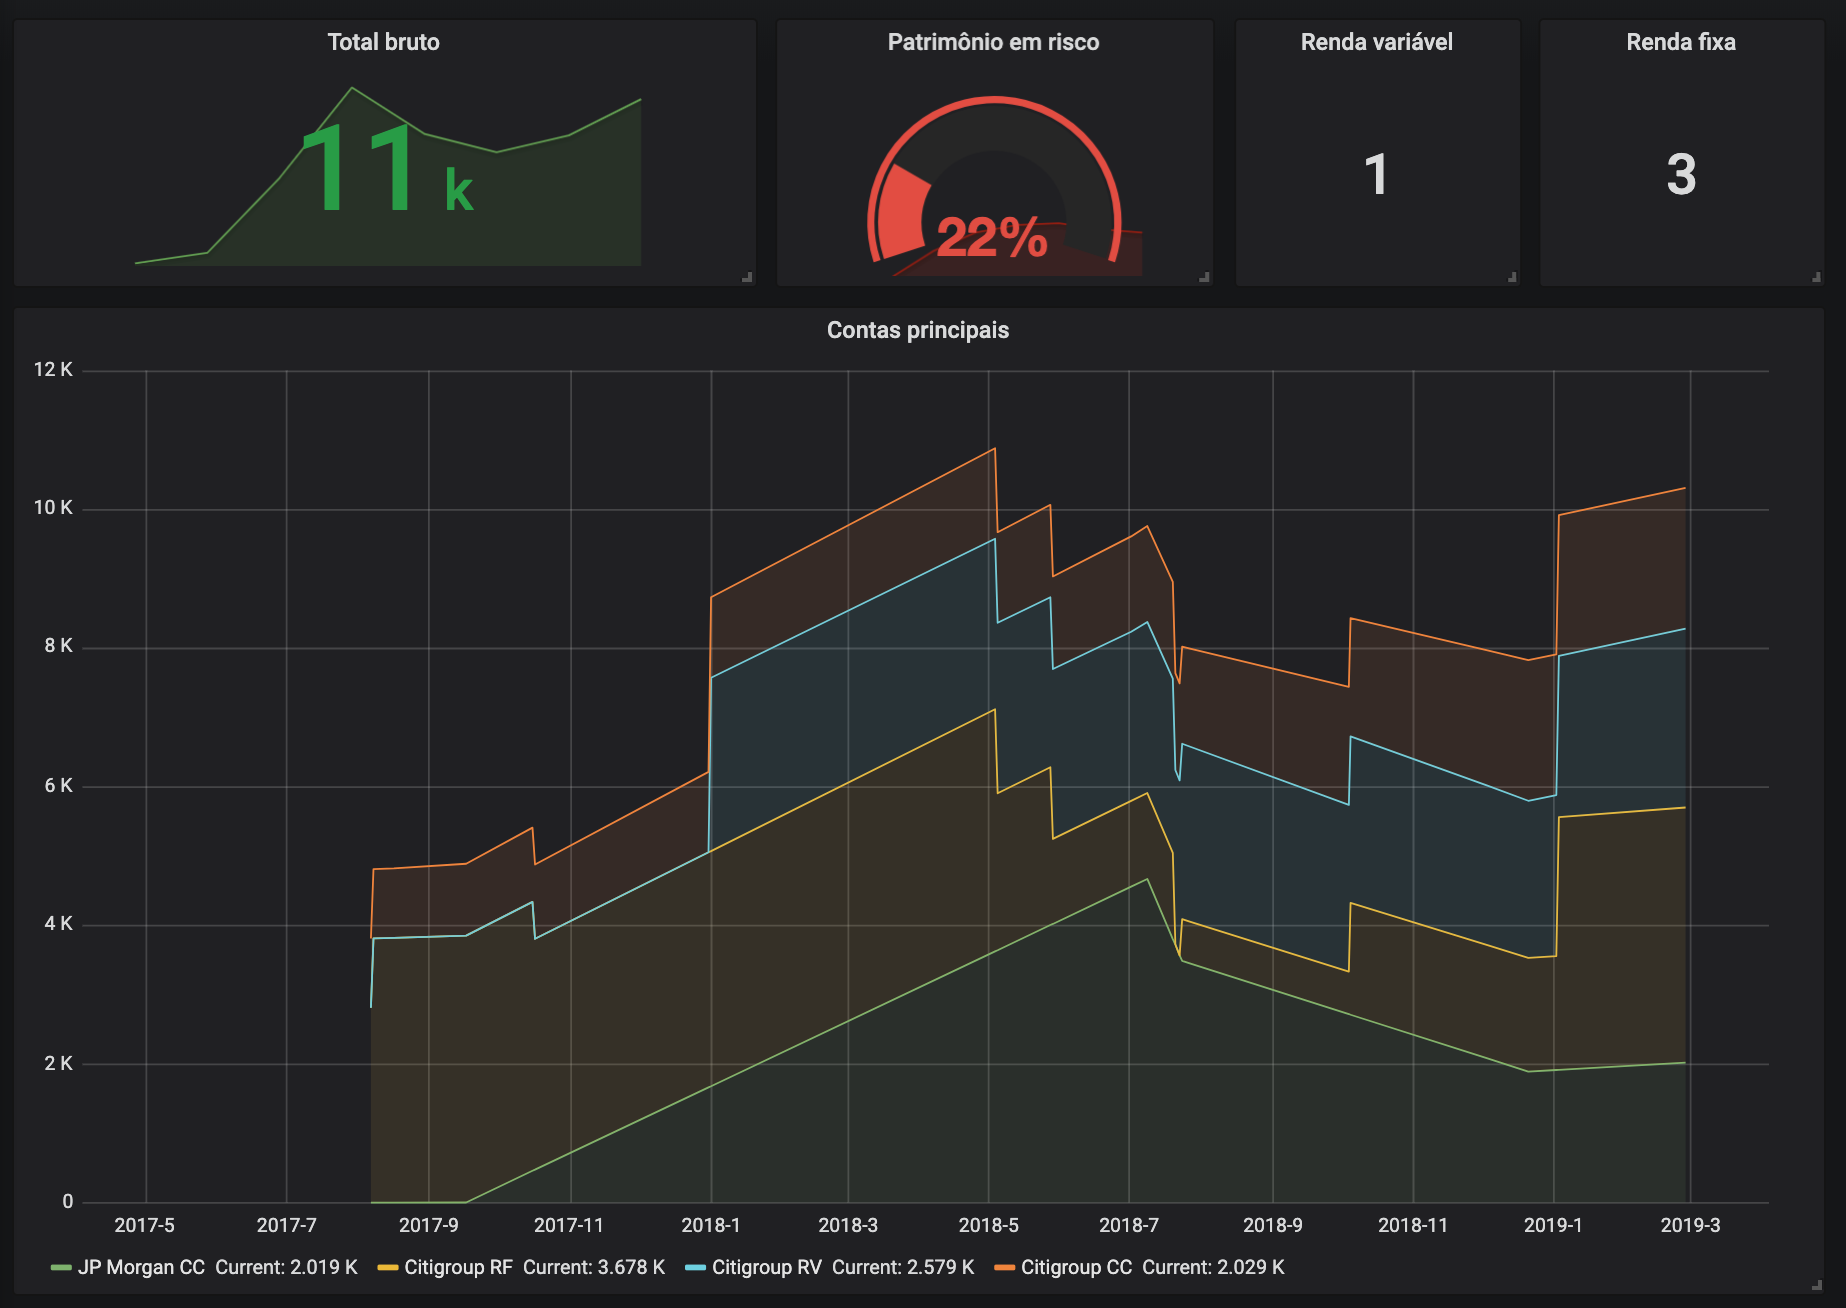
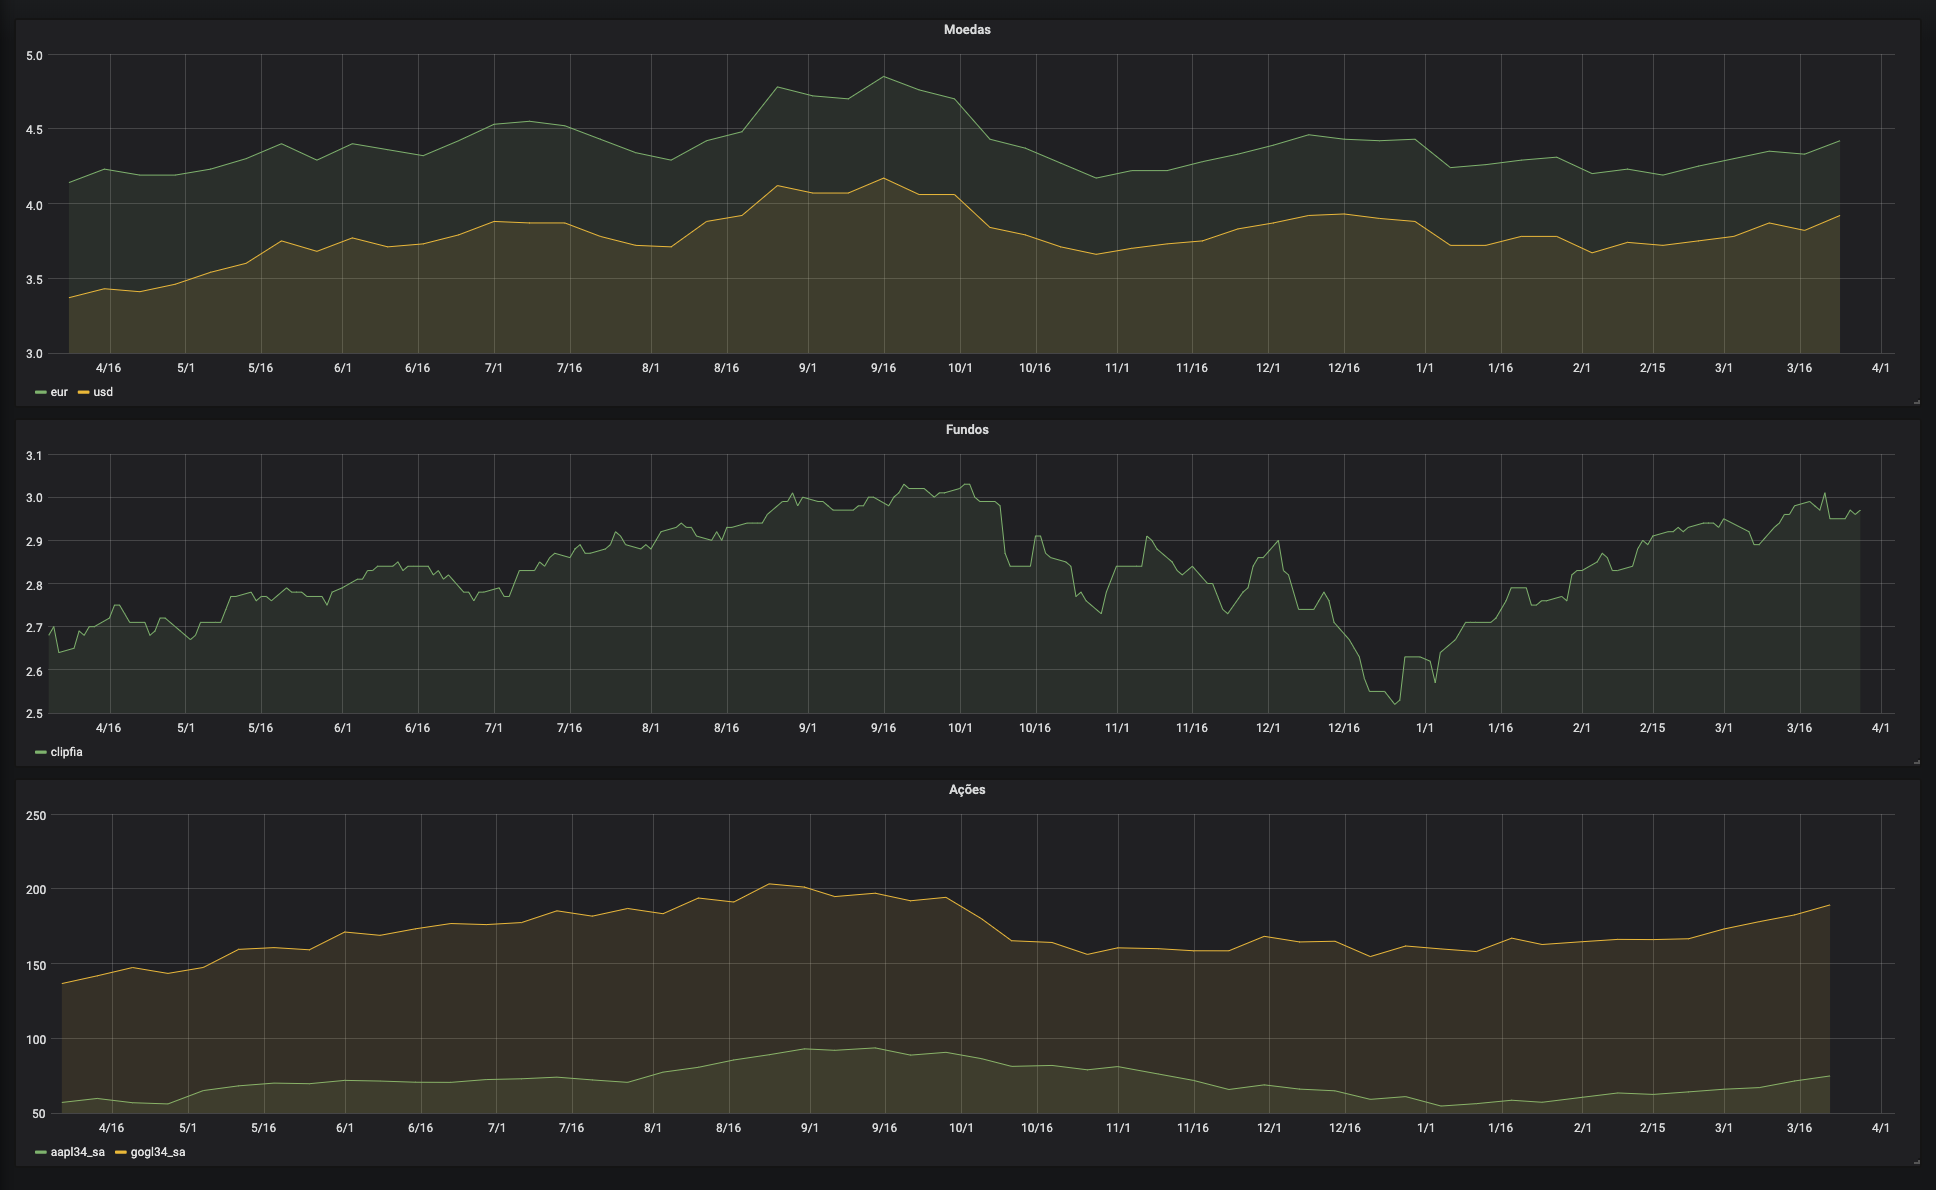
Fortunately, Grafana works out of the box with Graphite, so it was a piece of cake to build beautiful dashboards:
Tabular and scalar data
Even though piping data to Graphite made my life easier, it limited possibilities. There’s no simple way to display in a table all the info for yielding investments. Or adding a single stat with the next investment maturity date.
It became clear I had to add a second data source. Considering that some steps before I already had all the data in Clojure code, I decided to upgrade the Clojure scripts to an HTTP server.
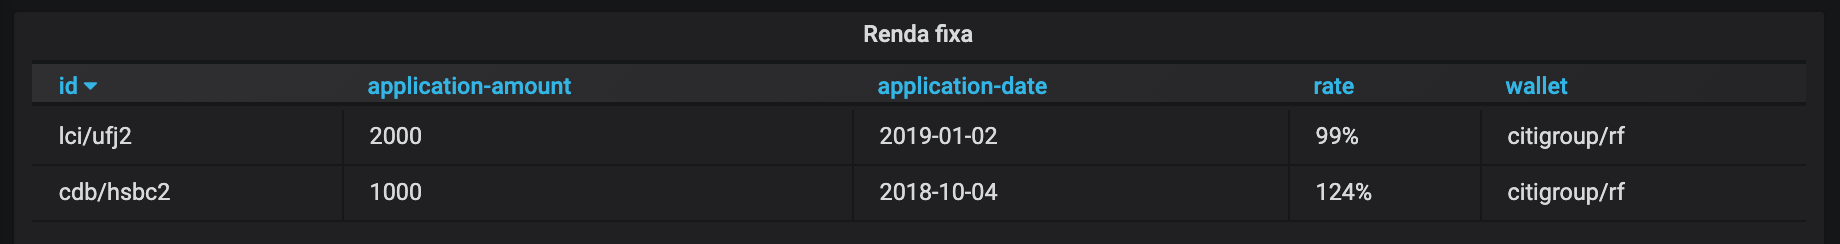
Grafana has support for JSON APIs as data source. Its serialization format is different from Graphite’s but I only had to write yet another pure, adapter function to get a result like this:
Extras
After finishing all the groundwork, it became easy peasy to add new features, such as consuming external APIs for displaying stock values or currency history, to name a few.
This is a complete edn file specifying what currencies and stocks we should keep track of.
Deploying
The easiest way to install Grafana on OSX is to use brew. Then you run brew service start and have to remember to stop it because the service persists even after a reboot. Then there's Graphite and Clojure.
Maybe there’s a better way to do it but I rage quit it and started using docker for everything instead.
By mounting volumes, we can start Grafana pre-configured with the default data sources and dashboards in a such way that we don’t have to set it up manually everytime.
Adapting it to your needs
The code is available on Github for you to fork. It’s a little bit oriented to my needs and the Brazilian financial system. However, smalls adjustments should be enough to adapt it.
Conclusion
I’m very happy with the result because I was able to develop it quickly, without having to learn new tools. The way the namespaces and models are organized facilitates swapping backends or splitting the code into microservices, if the future demands it.