Using a spreadsheet as a timeseries database for finance
Context
I have already tried using personal finance apps but there's always a feature missing or an inconsistency in results.
Unhappy with the experience, I created a simple spreadsheet half a decade ago. It lacked features and quickly became unmaintainable.
I decided to build my own tool instead. I started with a React (Native) Clojurescript web/mobile app. I never finished it.
I created a system using Clojure and Python, paired with Grafana. It worked pretty well, actually, but I never managed to deploy it in a free/cheap hosting service, because of JVM's and pandas' requirements.
I converted the codebase to Rust as a pet project. The memory and processing footprints became negligible. Cool!
But every once in a while I need to perform a simple calculation on the data, or plot an ad-hoc graph, or explore something new. Cloning repositories, editing the source code and recompiling everything isn't fun.
Spreadsheets are good at that. Ironically, I decided to go back to Google Sheets. But this time for real.
Architecture diagram
Here's the diagram of the complete system:
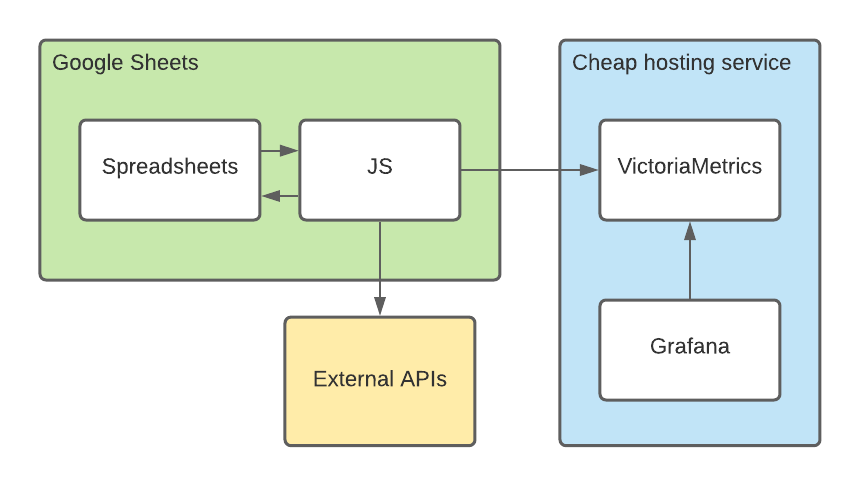
I'll cover each section in more details.
Using Google Sheets for input
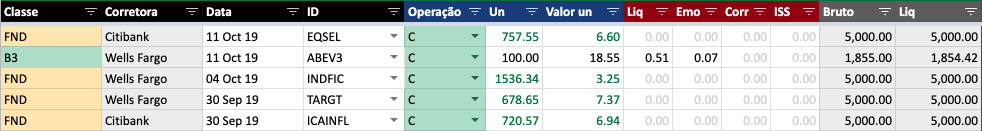
One of the requirements was that, as before, input should be minimal. In this case, it should basically be an event log of money transfers:
An extra sheet was necessary to completely define some investments. NASDAQ:APPL is all the input you need to define Apple's stock -- provided you get data externally --, but some fixed income investments have their own criteria -- e.g. rate of interest.

Using Google sheets for processing
Handling input was the easy part. Fetching data from APIs and doing the math is complicated laborious.
I can't get my head around =ARRAYFORMULA(IF..., VLOOKUP(...FILTER(...(INDEX...(MATCH...))))) formulae. Fortunately, Google Sheets allows using Javascript for manipulating sheets. It's not Rust my favorite language but at least it has .map(), .filter() and alike.
After so many attempts building the same system, I came up with a mental model which I didn't want to abandon so I replicated it once again.
To implement a timeseries database, a single spreadsheet was used. The y-axis represents time; the x-axis, different vectors:
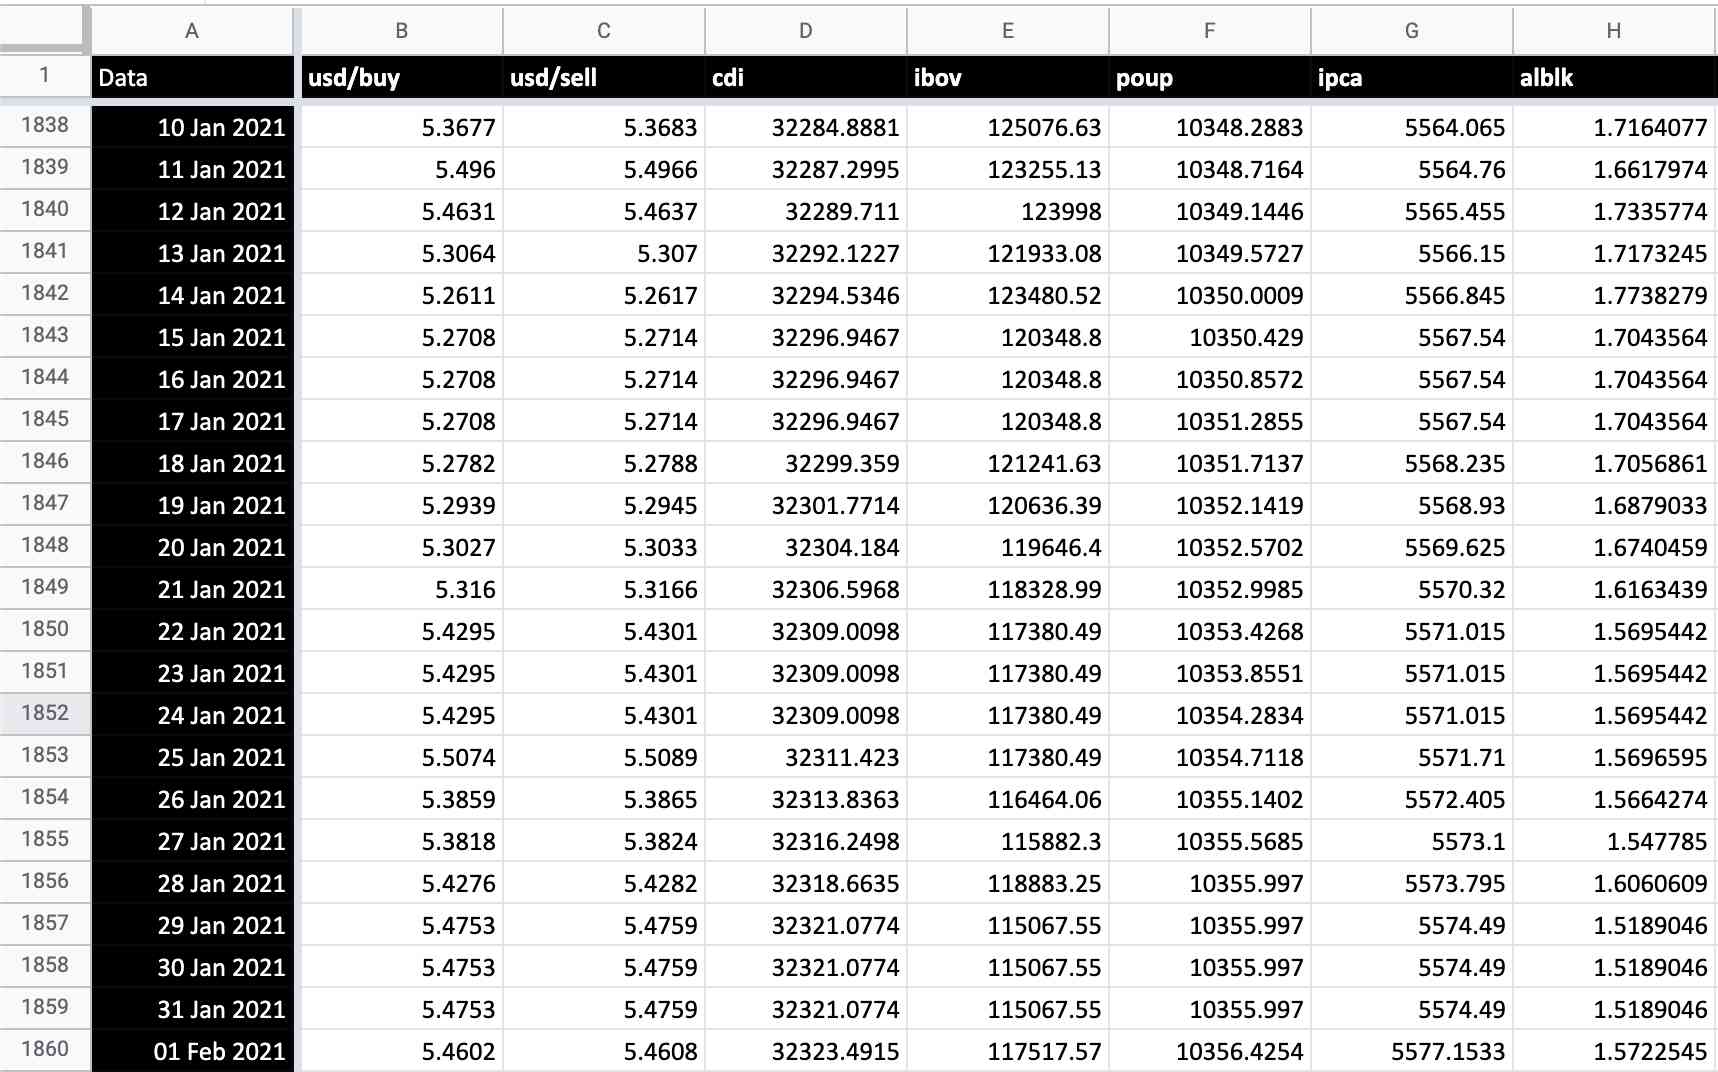
In Javascript we can read from and write to this sheet as if we were using a real timeseries database. Effectively, this made my new code look very similar to the previous ones:
// old
influx.emit(today, 3.12)
// new
tsdbSheet.setValue('D67') = 3.12

// old
config = readFromFile('./config.yaml')
foo = config.foo
// new
foo = configSheet.getValue('A2')
Abstractions
These low-level spreadsheet operations were abstracted away, in order to make the rest of the code agnostic to Google Sheets. Should I decide to port it elsewhere, I'll only need to edit some parts from the TSDB, EventLog and Config classes.
For example, calculating balances looks like this:
config.assets.forEach(asset -> {
   const balance = range(startDate, today).map(date => {
      const value = someMath(asset, date, tsdb)
      return [date, value]
   }
   tsdb.save(asset.id, 'balance', balance)
})
Getting historical data for stocks isn't any different:
config.assets
   .filter(asset => asset.kind == 'stock')
   .forEach(stock => {
      const price = callSomeApi(asset.id)
      tsdb.save(asset.id, 'price', price)
   })
Similarly, to prevent some input, the following is executed on startup:
config.assets
   .filter(asset -> asset.reachedMaturity())
   .forEach(asset -> eventLog.save('sell', asset.id, asset.maturityDate))
Finally, this allowed me to achieve what I already had in the early designs but with 3 benefits:
- I can access it from anywhere, as long as the device supports Google Sheets
- I edit tabular data, instead of a difficult-to-maintain
.ymlfile versioned in a private Github repository - I can quickly run an ad-hoc
=SUM(FILTER(...)))against my data if necessary
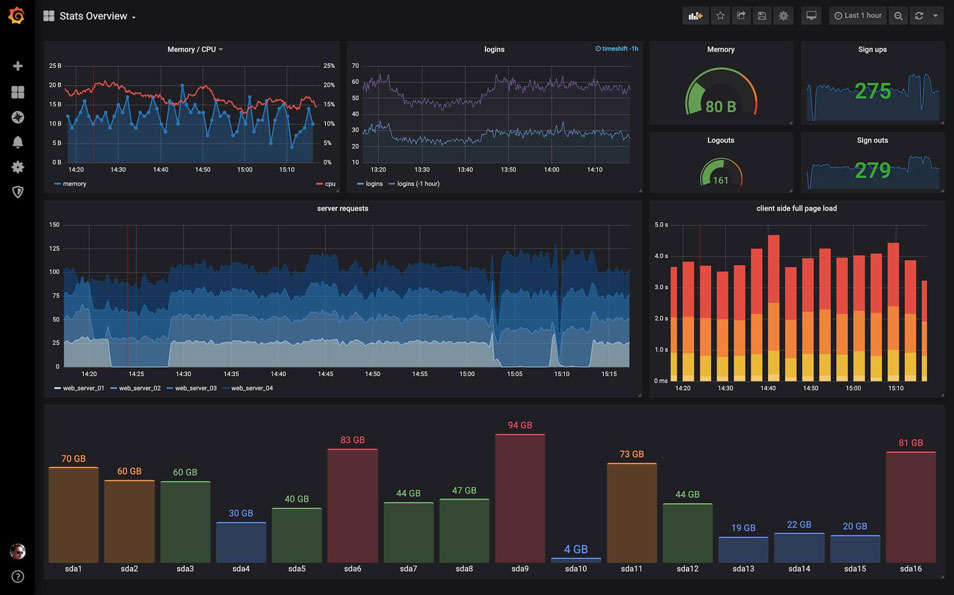
Dashboards
Spreadsheet formulae are cool but I still like looking at dashboards and plotting graphs on the fly, so I reused the architecture I already had on top of Grafana. I don't want to share screenshots here but the dashboard looks like any regular Grafana one:
For example, I can quickly write a query to compare the portfolio performance against the Ibovespa index.
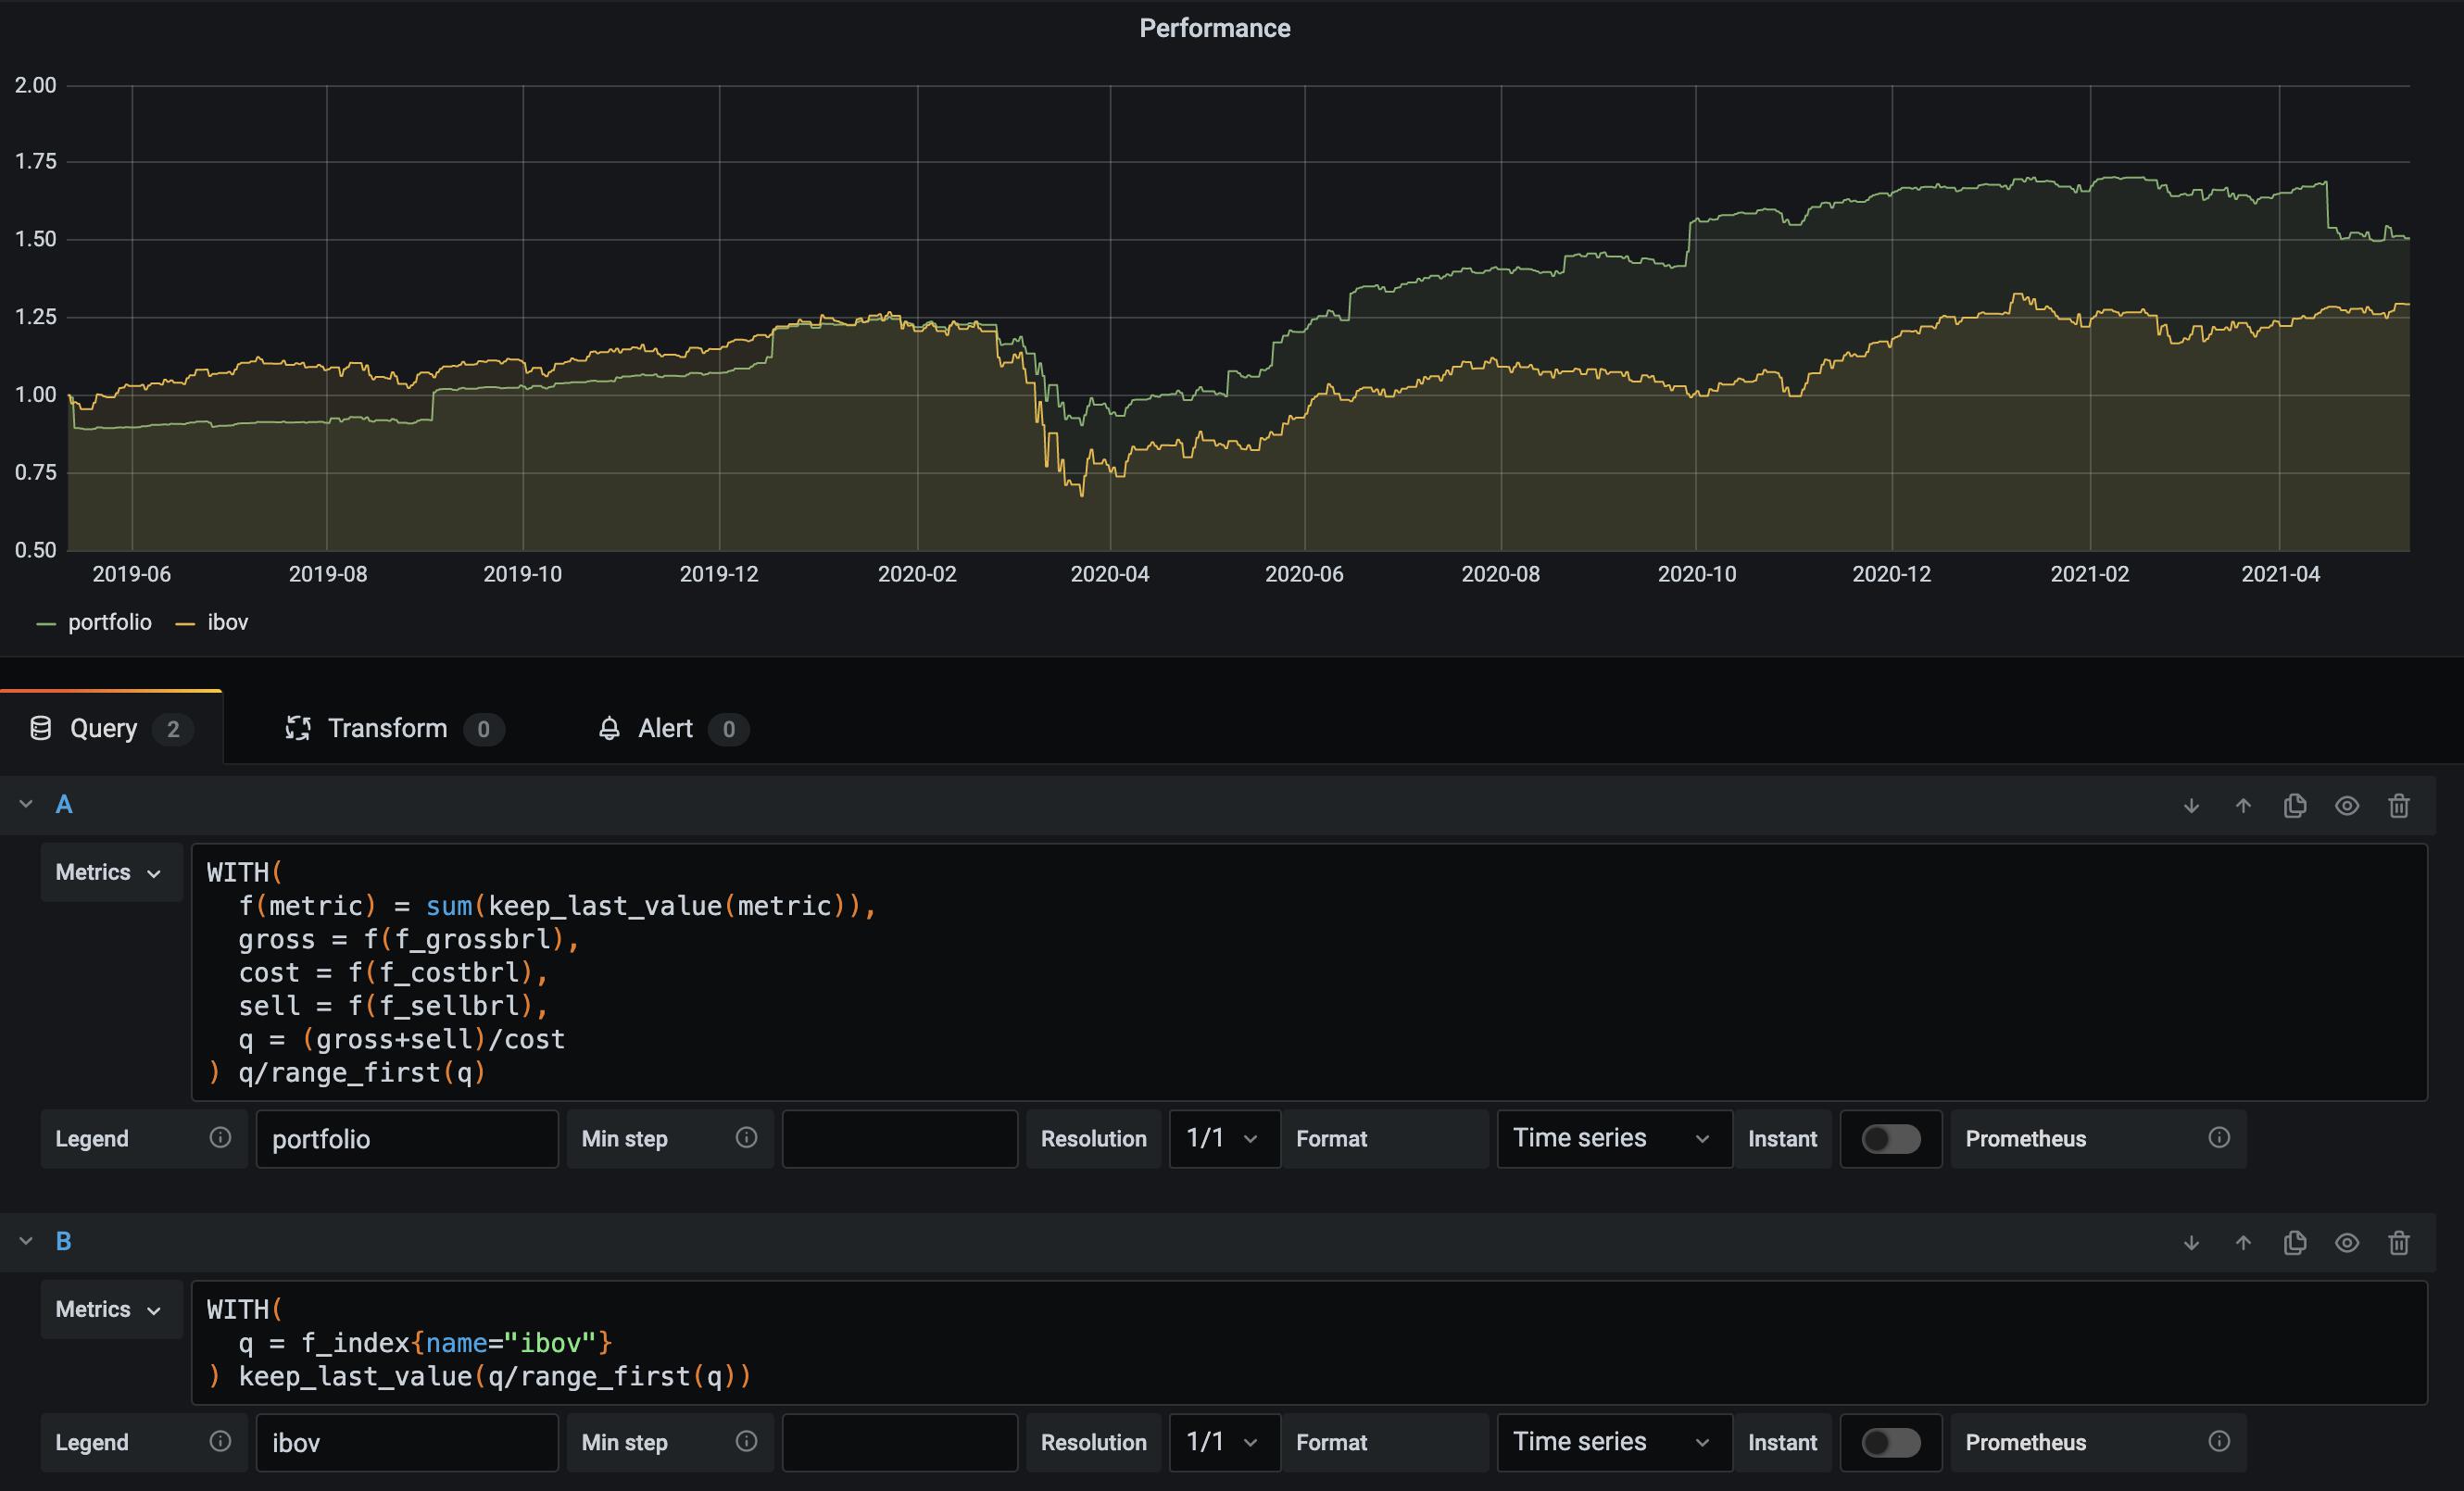
sum(...) by (broker) would do the trick(Real) timeseries database
I decided to VictoriaMetrics this time. It's fast and it has support for a much needed feature: backfilling. In other words, I'm able to emit values for timestamps in the past.
Its query engine is called MetricsQL and is a superset of PromQL.
I'd like to highlight 3 features from MetricsQL:
-
keep_last_value: only one data point per day per series is emitted. Anything above this would be redundant, since I don't day trade. However, Grafana asks forndata points per day,nfunction of the width of the panel in pixels and is normally greater than 1. Withoutkeep_last_valuethe plots would contain gaps. Summing metrics with gaps in different positions is erratic, because gaps are interpreted as 0. -
WITHstatement: this lets query aliasing, which is pretty handy. By the way, if you likeWITHtoo, you may like pipers. -
range_first: with this function I was able to normalize investment performances so that they all start with 1, making comparisons a breeze, as seen above.
Exporting/importing data
I added an Export button to Google Sheets which exports the contents from the spreadsheets to Grafana:
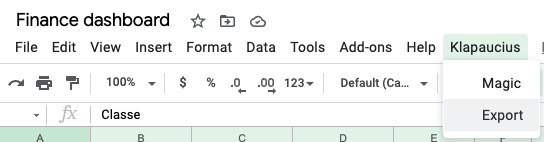
It simply serializes the in-memory data structures as JSON text and sends it in a POST request.
Notes on performance
The Rust implementation was able to read the config file, make all requests in parallel, calculate everything and export all data to Grafana in ~5 seconds.
I expected my first implementation in Google Sheets to be slower, or course. But I didn't expect it to be SO SLOW. The first implementation took 45~60min to finish processing. At least that's what I estimate, because I wasn't patient enough to wait for it.
The problem is that sheet.setValue(...) takes 500ms~3s for each cell. Also, switching between read and write modes takes about the same time. If you consider that each investment generates ~10 timeseries -- average price, balance, etc. -- and that each timeseries has 365 data points per year, then you'll see that this quickly explodes.
This reminded me of the problem that frameworks like React faced. Manipulating the DOM is slow, so they ended up creating a virtual representation of the DOM. I did the same, but for spreadsheets. It sounds complicated, but it isn't.
Basically, tsdb.save(...) doesn't manipulate the sheet directly but mutates an in-memory data structure instead. Later on, it sets the values for ranges instead of cells, in batch. The "public" APIs remained the same -- only the implementation details changed.
After these optimizations, the script takes less than a minute to complete.
This could be improved even further, but I don't want to make the code more complex just to save a few seconds once a month.
Result
To be honest, it's likely that a couple of months years from now I'll decide to write everything from scratch yet again.
It's not you, project of mine. It's me.
But I'm sure of one thing: the system has never been so flexible and portable.
Codebase
The spreadsheet and the source code are currently private because it would require some effort to make them shareable -- from privacy, security and usability standpoints.
Please reach out to me if you're interested in it, though. Maybe I can come up with something! 👍
In the meantime, I highly recommend dlombello's spreadsheets, which should fit most people's needs.